
Two weeks in the hot path: 40% less CPU, p99 from 547 to 4.7 ms
What we found when we profiled the HTTP request path, why cryptography turned out to be irrelevant and how blocked traffic became five times cheaper to handle.

For the past two weeks we did not ship any new features. Instead we went through the hot path of our web traffic handling and removed everything the CPU was paying for without reason. The goal was simple: make every HTTP request cheaper, gain headroom on the same infrastructure and, above all, get predictable behaviour under attack rather than only on quiet traffic.
The changes touched almost the entire chain: site configuration, the rules engine, fingerprinting, bot detection, logging, event aggregation and the delivery of live blocks. In numbers: throughput on individual scenarios grew by 30–70%, blocked traffic is handled up to five times faster and the p99 of the heaviest scenario dropped from 547 ms to 4.7 ms. The filtering result did not change in a single test — that was a precondition for every change.
Profile first, then touch anything
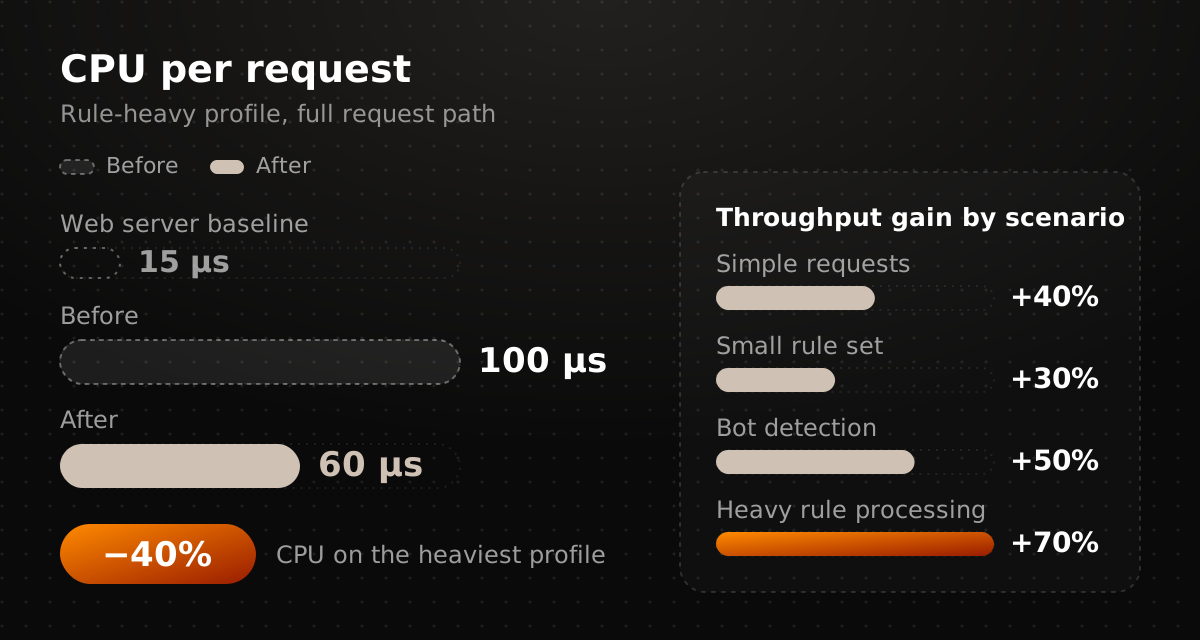
Before we started, the full path of one request cost about 80 µs of CPU, or roughly 100 µs with logging. For comparison, the web server's baseline handling of a request without our logic is about 15 µs. In other words, the bulk of the cost was not in the server itself but in everything we had built around it: rules, request context, fingerprinting, logs, aggregation.
The first hypothesis was the obvious one — the cryptography inside the anti-bot checks must be expensive. The profiler disagreed: cryptographic operations accounted for less than 0.3% of the time. The expensive parts were things that look free in isolation: string handling, temporary structures, request variable lookups, garbage collection.
That is probably the main takeaway of the whole series. In a busy L7 service there is rarely a single function you can rewrite for a twofold gain. Performance leaks through dozens of small operations that run on every request, and you have to collect it back piece by piece.
The main request path
Do not do work that is not needed. Parts of the configuration used to be computed on every request regardless of whether the site used the corresponding feature. The rules engine had a similar issue: the request context was assembled before we knew that the site had no rules at all. We added a cache for prepared configuration and early exits. On sites without active rules the cost dropped by 15–20% and throughput grew by almost 20%. Architecturally the change is tiny, but at volume the difference between "check one flag" and "build several structures and throw them away" shows up immediately.
Known bots without a linear scan. The IP range check performed noticeably more sequential comparisons than necessary. We replaced that path with a prefix lookup structure and reduced the number of extra ASN checks on a miss. Known-bot detection became 15–17% cheaper and throughput on the corresponding scenarios grew by about 20%. Along the way we found excessive logging of successful matches and moved it out of the hot path.
Fewer small allocations. In one anti-bot component we removed an intermediate request structure and an unnecessary string for a single check — around a hundred bytes of temporary data per request. The CPU difference is within measurement error, and we say so openly. But the fewer short-lived objects there are in the hot path, the less pressure on the allocator and the garbage collector over a long run, so we make these changes anyway.
After several iterations we repeated the A/B measurements. The cost of the main request handling fell by 25–40% depending on configuration complexity; on the most rule-heavy profile it went from 100 to 60 µs. Throughput grew by 40% for simple requests, 30% with a small rule set, 50% in bot detection scenarios and up to 70% on one of the heaviest rule-processing profiles. Functional equivalence was verified on several thousand test cases covering different rule actions and bot detection — no differences.
Logging: cheap on normal traffic, expensive under attack
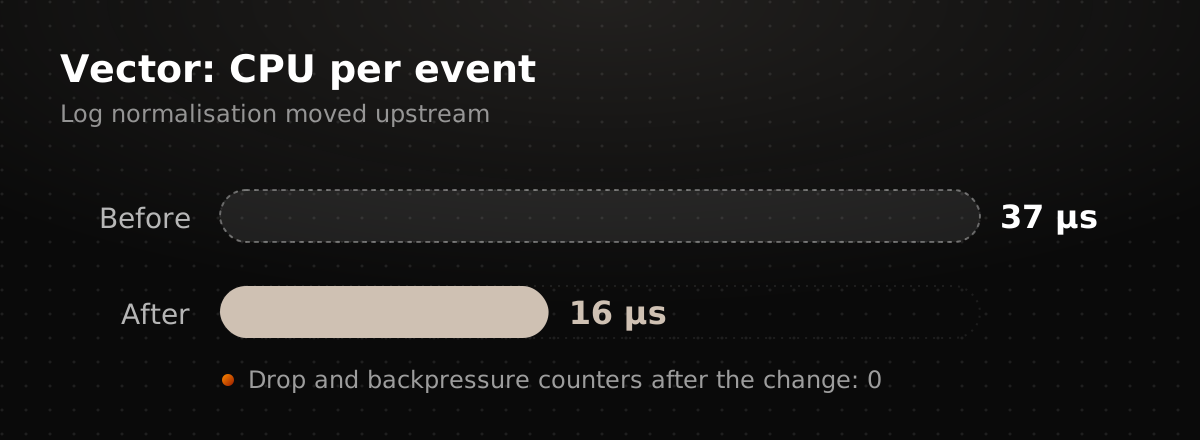
Once the main path became cheaper, it was much easier to see how much CPU went into handling the event after the response. Part of the log normalisation ran inside Vector, and under a heavy stream that transform cost about 37 µs per event. We moved the simple operations closer to where the event is produced: timestamp conversion, URL assembly, response time and status normalisation. Vector now receives a ready-made stream, and the per-event cost dropped from 37 to 16 µs. Previously, at peak load, some events were lost on overflowing queues; after the change the drop and backpressure counters stay at zero. We also caught a rare bug on the way: a negative response time in one record caused a whole batch to be rejected by ClickHouse.
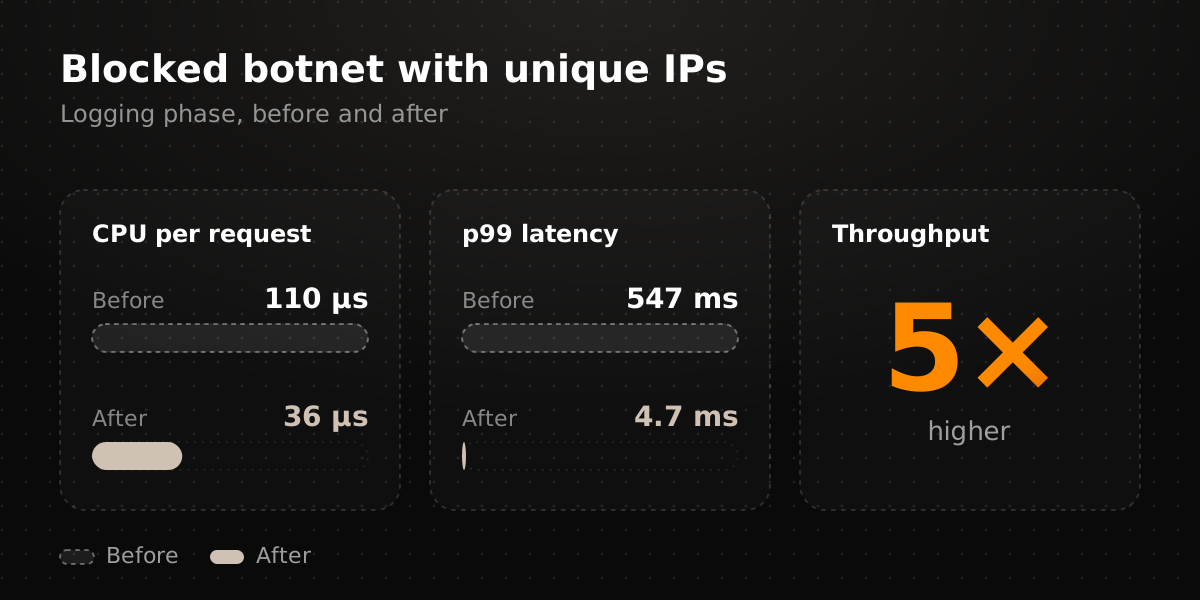
Then we did what we should have done earlier: stopped measuring the logger on normal traffic only. On regular requests logging looked cheap at 10–15 µs. But when we reproduced a profile that resembles a real attack — many blocked requests from constantly changing IPs — the picture changed radically. The old aggregation periodically walked a large shared state table, synchronously and under a shared lock. With tens of thousands of entries the request handling time grew from 50 to 110 µs, throughput fell by about 70% and the p99 reached 547 ms. Almost a third of the time the request was waiting for access to the shared structure rather than being processed. Code that is invisible in the profile on quiet traffic can become the most expensive part of the system during an attack.
We moved the hottest part of logging — serialisation, framing and delivery of events — into a separate Rust component. In a microbenchmark the operation went from 5 to 2 µs per event; in the full request path the gain is more modest, about 40% of the CPU that went into serialisation. On scenarios with many unique blocked IPs throughput grew by a further 30–50%. More importantly, in a stress test where the old implementation started building backpressure and failed to deliver most of the stream, the new one handled it in full.
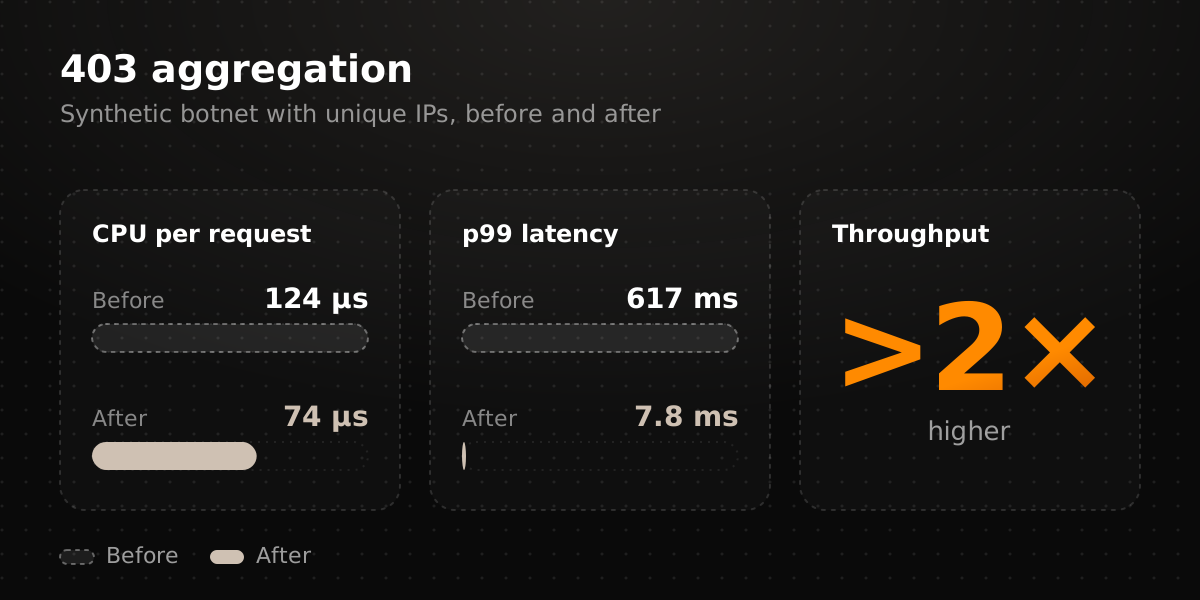
Next, aggregation of mass 403 and 429 events moved into the same component. The new design performs no global scans and does not make the request path compete for a single lock: aggregation is local and memory is capped by a predefined budget. On a synthetic botnet with unique IPs the 403 scenario went from 124 to 74 µs per request, p99 from 617 to 7.8 ms, and throughput more than doubled. Another 403 profile gave roughly −40% CPU and the same 2× throughput; for 429 it was about −30% CPU and almost 2×. The overflow case, when the number of unique sources becomes very large, is now handled at 37 µs per request with a p99 of 1–2 ms. Counters and metadata match the old implementation.
The last finding in the logging phase was unexpected: fetching request variables one at a time. Each lookup costs less than a microsecond, but there are several dozen per logged request, adding up to about 20 µs. We wrote a small native module in C that fetches the required fields in a single call. The full path on regular logged traffic went from 60 to 40 µs, and on some scenarios throughput grew by more than 50%. We compared the old and new implementations on HTTP/1.0, HTTP/1.1 and HTTP/2, different status codes, proxy and cache scenarios, long User-Agent headers and query strings — no differences.
Adding up the whole series: a regular logged request became about 40% cheaper. On the blocked botnet the cost fell from 110 to 36 µs per request, throughput grew fivefold and the p99 went from 547 to 4.7 ms — more than two orders of magnitude. To us that matters more than the RPS figure: a protection system has to keep predictable handling time precisely when the attacker is deliberately creating the worst possible load profile.
The blocking path
The last big block was the delivery of live blocks. The old implementation was written long ago and had gradually turned into a multi-stage chain with several userspace hops and a Python service in the middle. It worked on normal load; the problems started on bursts.
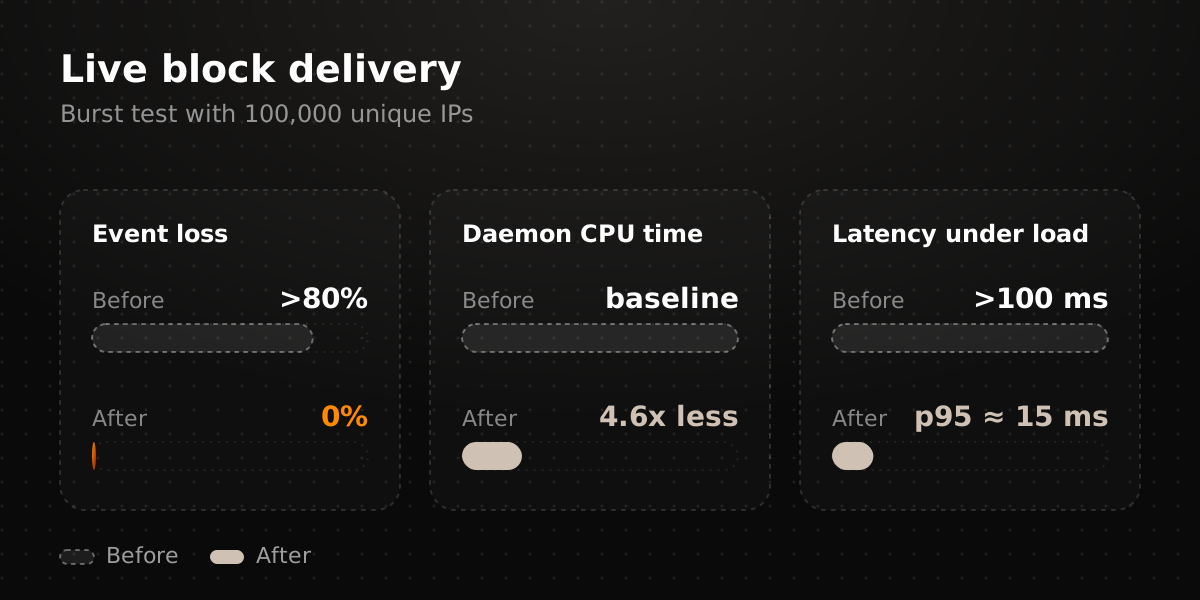
In a test with 100,000 unique IPs the old pipeline lost more than 80% of incoming events. The new Rust service handled the entire stream with zero loss, and the daemon's CPU time during a large series of blocks dropped by a factor of 4.6. Even more telling is the behaviour when the CPU is busy: with the cores loaded by regular HTTP traffic, the old service's latency could exceed 100 ms, while the new one kept its p95 around 15 ms. The blocking path has practically stopped depending on the load of the request-processing layer. The hottest blocks are now written directly via XDP/eBPF, and the state needed by other components is synchronised through Redis.
What a real attack showed
During one of the attacks on a protected project we saw a problem that synthetic tests barely revealed. Most of the malicious requests came from IPs that had already been recognised and blocked locally, but open HTTP/2 connections let the source keep sending requests after the block decision. On some sources the number of requests after the first trigger ran into tens of thousands.
We changed several parts of the logic at once: block escalation no longer depends on the site's current RPS measurement; the lifetime of long HTTP/2 connections is capped more tightly; load estimation no longer relies solely on the incomplete current second; mass early-rejection events are aggregated rather than serialised one by one. We deliberately do not publish the exact thresholds and parameters. The principle is simple: once the system has confidently identified a source as an attacker, every further request from it should cost us as little as possible.
The outcome
| Component | Before | After |
|---|---|---|
| Main path, rule-heavy profile | 100 µs/request | 60 µs/request |
| Throughput by scenario | — | +30–70% |
| Vector, one event | 37 µs | 16 µs |
| Logging of a blocked botnet | 110 µs, p99 547 ms | 36 µs, p99 4.7 ms |
| 403 aggregation, unique IPs | 124 µs, p99 617 ms | 74 µs, p99 7.8 ms |
| Blocks, burst of 100,000 IPs | >80% lost | 0% lost |
| Blocks, latency under load | >100 ms | p95 ≈ 15 ms |
For a typical complex logged request, individual measurements show roughly a twofold CPU reduction. One caveat: that figure comes from combining the results of several independent A/B series rather than a single end-to-end benchmark, so we treat it as an estimate, not an exact result.
In DDoS protection, performance is not "more requests per second". Every extra microsecond in the hot path is cores that have to be added with infrastructure during an attack: 20 µs per request on a large constant stream becomes several fully occupied CPUs. But something else matters more. After these two weeks the system has noticeably fewer places where load could degrade behaviour non-linearly: global scans, contention for shared state, log backpressure, the blocking service's dependence on the HTTP layer's load. Those are exactly the places that usually turn high load into cascading degradation.
We rewrote some components in Rust and C, reworked some algorithms and simply stopped doing some operations where they were not needed. The fastest CPU instruction is still the one you never had to execute. Questions about this work are welcome in our Telegram channel, and you can follow the state of your own projects in the workspace.